Monitor an endpoint and get told when it breaks
You already saved the request, with its headers, body and variables. Turn it into a check: Pipehero sends it on a schedule to staging or production and emails you when it fails.
Pro includes 5 monitors and Team 50.
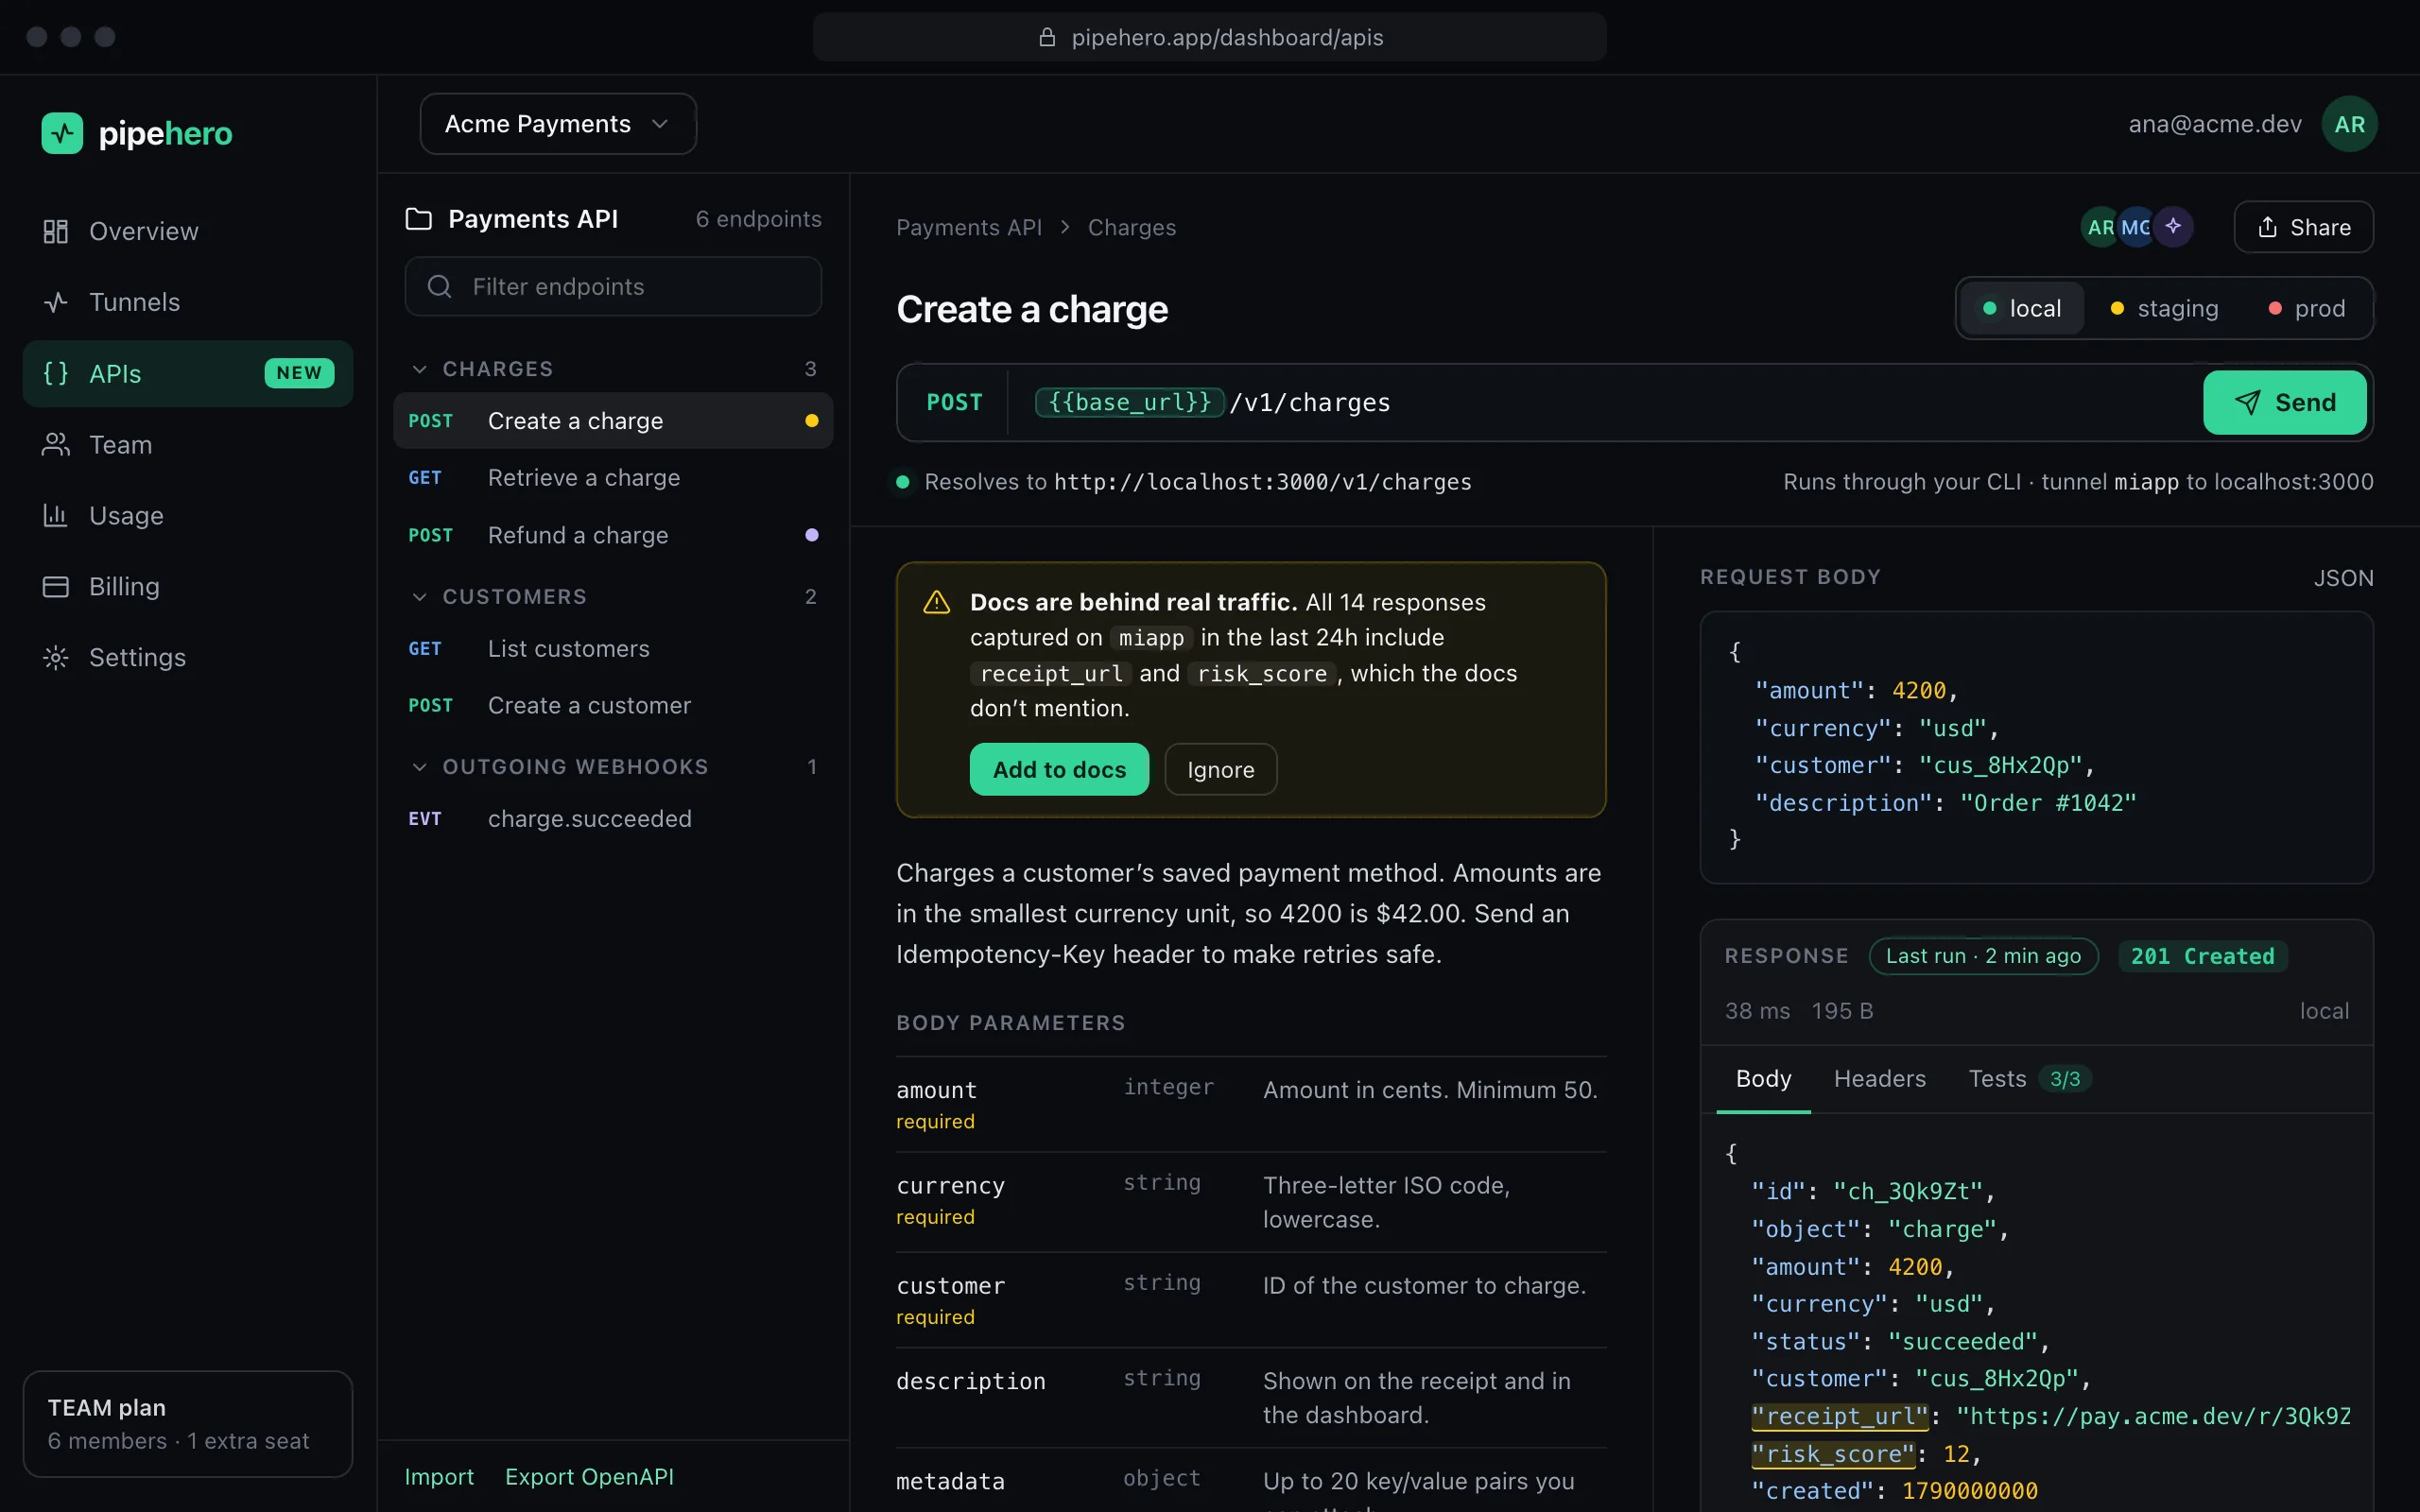
How a monitor works
Pick an endpoint, a cloud environment and how often: every 5, 10, 15, 30 or 60 minutes, every 6 hours or once a day. Each check goes through the same runner as pressing Send, so it uses your variables and secrets.
What counts as healthy
- ›By default, any 2xx status.
- ›Optionally, an exact status, a maximum latency, and text the response must contain.
- ›A request that can't be made, or gets no answer, is a failure with its reason.
Alerts that don't flood your inbox
One failed check can be a blip. After two in a row you get an email, once per failing streak, and another when it recovers. It goes to the workspace owner or to an address you choose.
Safe by design
- ›Production monitors only run GET and HEAD, so a check never writes to production.
- ›Only cloud environments can be monitored: Pipehero's servers can't reach your localhost.
- ›Checks follow the same guards as cloud runs (public addresses only, no redirects, size and time caps).
- ›Checks don't fill the endpoint's run history and don't use your runs-per-minute budget. Each monitor keeps its last 100 checks.
See what's failing from your editor
The list_api_monitors tool shows your agent which endpoints are monitored, which are failing, the last error and since when. It is read-only: people decide what gets monitored and who gets the email.
FAQ
Can I monitor an endpoint on localhost?
No. Checks run from Pipehero's servers, which can't reach your machine. Use the desktop app or a local environment to test locally.
What happens if I go over my limit?
You can't create more monitors until you delete one or upgrade. Monitors only run while the workspace is on Pro or Team: on the Free plan they stop until you upgrade again.
Is this a replacement for an uptime service?
It is a check built from the endpoint definitions you already have, with email alerts. It doesn't have status pages or on-call rotations.
Keep reading
Everything is in the API workspace docs, and the other parts are Import OpenAPI and Postman, Document your API from real traffic, Keep API docs current with AI.
Document and test your API in minutes
Free plan, no credit card. Import a spec or start from your webhooks, and keep it true from there.
Get started free